
Speqto technologies cater the best-customized Data visualization consulting and solutions to assist you with all the anticipated service requirements incorporated with the KPIs to recognize your business growth.
.webp "visulation-image")
Data Visualization is one of the techniques to interpret the compiled raw data in the form of graphics, such as plots, charts, infographics, animation, or any visual context. Data visualization solutions assist clients in having more catchy and attractive information, which can be easily understood, and helpful in identifying patterns, and interpreting trends and outliers in large data sets.
It is a part of the Data science technique, which states that data must be visualized for the conclusions to be made in the future. It is also the sub-part of the broader data presentation architecture (DPA) discipline which aims to recognize, track, manipulate, strategize and deliver data most efficiently and effectively. At Speqto technologies we ensure to maintain the high-end quality standard in every data analytics service we offer to our clients in an effective and efficient optimized manner.
.webp "data-visualization-intro-update")
BI Dashboards balance engaging, usable visuals with a built-in performance design that allows insights to be shown on mobile and web devices without any glitches. This method can speed up interaction while decreasing load times.
Utilize data visualization to enhance your company intelligence and analytics. We provide detailed data dashboards and reports for a wide range of business users, including people who are not analytics experts.
Data sets are often prepared for business intelligence (BI) and analytics applications using a common process called data preparation. In order to provide considerable business value.
Modernization initiatives work hand in hand with next-generation platforms that support business intelligence, direct engineering teams, and establish cutting-edge practices in their daily decision-making.
.webp "data-visualization")

We Integrate data preparation and visualization in one cloud platform. Present complicated datasets graphically, find relationships, and spot trends to quickly connect the forces influencing the firm:

We design specialized reports and dashboards for a variety of users, including:

Speqto is a leading Data analytics agency that offers you the services to gather, examine, and display your data by:

We improve your data visualization service by making it more efficient at many architectural levels:
Choose SPEQTO Technologies skilled and proficient developers for react native mobile app development.
Read More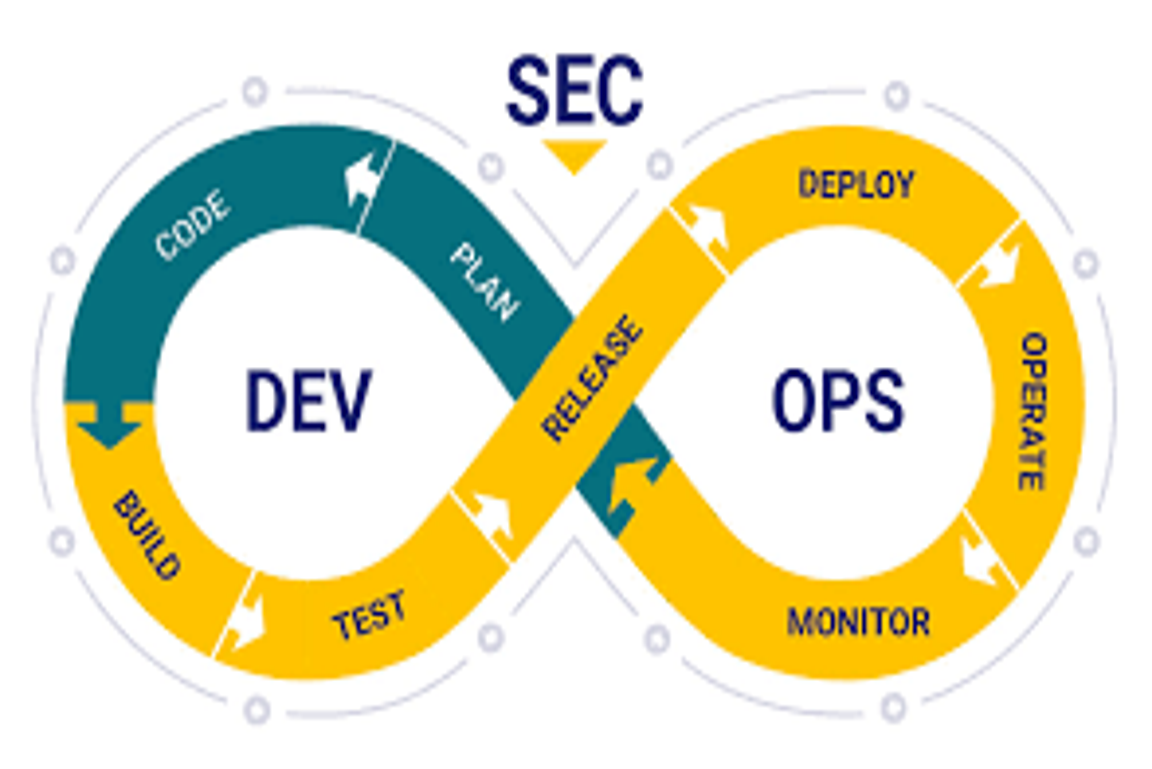
Author: Charu RajputDate: 6 March 2026 Introduction Modern software development moves very fast with DevOps practices such as Continuous Integration (CI) and Continuous Deployment (CD). While speed improves productivity, it can also introduce security risks if security checks are ignored. This is where DevSecOps comes in. DevSecOps means integrating security into every stage of the […]
Read More
How IT Companies Can Win Global Clients in 2026 Chirag Verma 06/03/2026 In 2026, the global technology market is more competitive and opportunity-rich than ever before. Businesses across industries are searching for reliable IT partners who can help them innovate, scale, and stay ahead in an increasingly digital world. For IT companies, winning global […]
Read More
Beyond the Battlefield: Architecting Your Web App with Optimal SSR or CSR Rendering Gaurav Garg 06 March 2026 In the dynamic landscape of web development, a fundamental architectural decision often dictates the success and user experience of a web application: the choice between Server-Side Rendering (SSR) and Client-Side Rendering (CSR). This isn’t merely a technical […]
Read More
The Human Side of AI: How HR Leaders Will Shape the Future of Work in 2026 Khushi Kaushik 06 march, 2026 Introduction As we step into 2026, the workplace is evolving faster than ever before. Artificial Intelligence, automation, remote work, and digital collaboration tools are transforming how organizations operate. But amid all this innovation, one […]
Read More
How to Choose the Right Software Development Partner for Your Business Kumkum Kumari 17/12/2025 Choosing a software development partner is one of the most important decisions a business can make. In 2025, technology is no longer just a support function it is a core driver of growth, efficiency, and competitive advantage. Many businesses struggle not […]
Read More
From Idea to MVP: A Step-by-Step Guide for Startup Founders Karan Kumar 17/12/2025 At Speqto, we work closely with startup founders who are driven by strong ideas but often face uncertainty about how to turn those ideas into real, working products. Entering the market quickly, validating assumptions, and managing limited resources are constant challenges. In […]
Read MoreSPEQTO caters all data visualization services as-Target specific audiences, Opting for relevant visuals, Delivering context, keeping things easily understandable, and attractive design for user engagement.
Despite having a position in the data science skill set, it's crucial to be aware of visualization's limitations, including the fact that human vision is imperfect and that visual resemblance does not necessarily indicate connection and the halo effect.
Initially, we should have a specific question, then start with basic visualization and be aware of your data, Identify the objective of the visualization and create an informative indicator, final step opt for the right visuals.
Any form of analytics data visualization skills is still in high demand. But business intelligence, data analytics, and other areas have started to adopt Business Intelligence visualization. In reality, more apps and processes are using visualization.
There are numerous scenarios when data could mislead in Data visualization such as Inappropriate methods of data collection, Inaccurate research parameters, unauthentic data sources etc.
SPEQTO assists many forms of data visualization such as:- Scatter plots, line graphs, pie charts, bar charts, heat maps, area charts, choropleth maps, and histograms are among the most popular types of graphs.
.webp "send-email")
.webp "send-email")
