Please submit your requirement and we will be happy to respond within 4 hours.
.webp "send-email")
Speqto technologies cater the best-customized Data visualization consulting and solutions to assist you with all the anticipated service requirements incorporated with the KPIs to recognize your business growth.
.webp "visulation-image")
Data Visualization is one of the techniques to interpret the compiled raw data in the form of graphics, such as plots, charts, infographics, animation, or any visual context. Data visualization solutions assist clients in having more catchy and attractive information, which can be easily understood, and helpful in identifying patterns, and interpreting trends and outliers in large data sets.
It is a part of the Data science technique, which states that data must be visualized for the conclusions to be made in the future. It is also the sub-part of the broader data presentation architecture (DPA) discipline which aims to recognize, track, manipulate, strategize and deliver data most efficiently and effectively. At Speqto technologies we ensure to maintain the high-end quality standard in every data analytics service we offer to our clients in an effective and efficient optimized manner.
.webp "data-visualization-intro-update")
BI Dashboards balance engaging, usable visuals with a built-in performance design that allows insights to be shown on mobile and web devices without any glitches. This method can speed up interaction while decreasing load times.
Utilize data visualization to enhance your company intelligence and analytics. We provide detailed data dashboards and reports for a wide range of business users, including people who are not analytics experts.
Data sets are often prepared for business intelligence (BI) and analytics applications using a common process called data preparation. In order to provide considerable business value.
Modernization initiatives work hand in hand with next-generation platforms that support business intelligence, direct engineering teams, and establish cutting-edge practices in their daily decision-making.
.webp "data-visualization")

We Integrate data preparation and visualization in one cloud platform. Present complicated datasets graphically, find relationships, and spot trends to quickly connect the forces influencing the firm:

We design specialized reports and dashboards for a variety of users, including:

Speqto is a leading Data analytics agency that offers you the services to gather, examine, and display your data by:

We improve your data visualization service by making it more efficient at many architectural levels:
Choose SPEQTO Technologies skilled and proficient developers for react native mobile app development.
Read More
What to Expect from a Reliable Software Development Partner Himanshu Raj Bhat 18 Nov, 2024 A reliable software development partner can often mean the difference between success and failure in the realization of a project. With the right partner, you gain a seamless, collaborative experience, technical know-how, and long-term support that extends beyond project delivery. […]
Read MoreBoosting Business Efficiency with Advanced Bots and Chatbots Himanshu Raj Bhat 18 Nov, 2024 Business nowadays is all about staying ahead in this fast-moving world with the full utilization of advanced technologies to smoothen operations and customer interactions. Among these latest technologies are bots and chatbots, which have emerged as excellent tools for business […]
Read More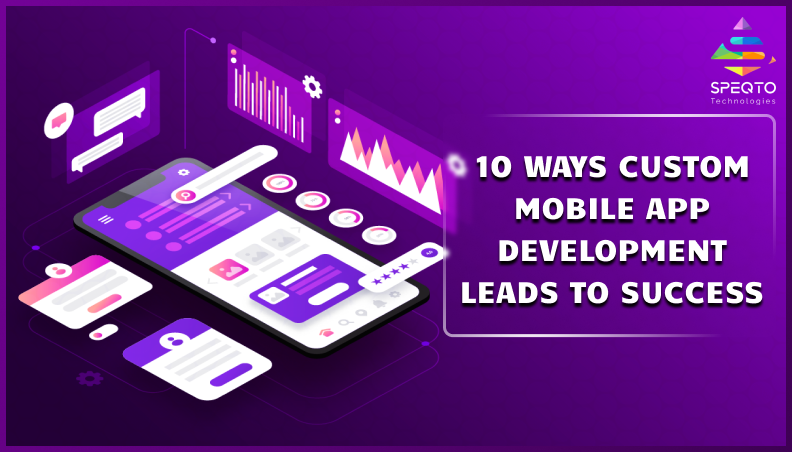
Mobile App Development Trends to Continue In 2024 Priyanka Singh 31 oct, 2023 INTRODUCTION Mobile app development is an ever-evolving landscape, driven by technological advancements, user demands, and business innovations. As we approach 2024, the momentum of growth and change in this arena shows no signs of slowing down. Let’s take a closer look at […]
Read More
What Is Data Science: Ultimate Guide To Explore Its Basics Priyanka Singh 30 oct, 2023 INTRODUCTION Data science is the intersection of various disciplines that converge to extract meaningful information and insights from vast sets of data. Merging fields like mathematics, statistics, computer science, and artificial intelligence, it plays a pivotal role in modern business […]
Read More
Top 6 Advantages of Hiring IOS App Development Company Priyanka Singh 28 oct, 2023 INTRODUCTION Businesses are continuously striving to provide a seamless user experience across all platforms.The iOS ecosystem, with its vast user base and reputation for superior design and security, stands out as a preferred platform for many enterprises. But why should businesses […]
Read More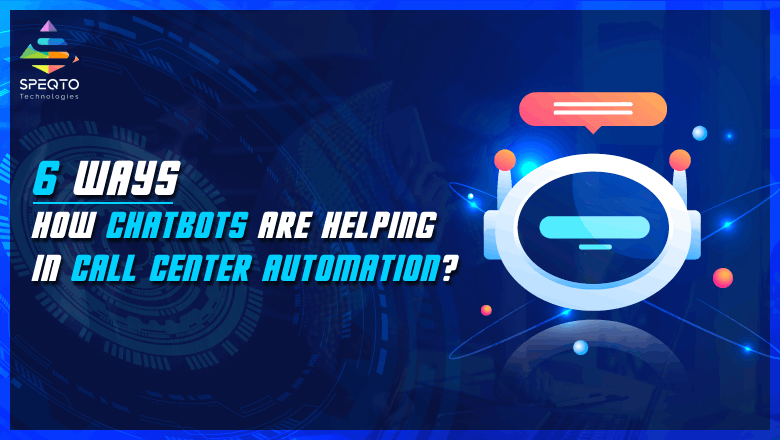
A Beginner’s Guide to Designing the Best Real Estate Website Priyanka Singh 27 oct, 2023 INTRODUCTION The real estate realm is no longer limited to open houses and face-to-face meetings. Instead, the property hunt often begins with a quick online search, turning websites into the new storefronts of real estate businesses.A well-crafted and functional website […]
Read MoreSPEQTO caters all data visualization services as-Target specific audiences, Opting for relevant visuals, Delivering context, keeping things easily understandable, and attractive design for user engagement.
Despite having a position in the data science skill set, it's crucial to be aware of visualization's limitations, including the fact that human vision is imperfect and that visual resemblance does not necessarily indicate connection and the halo effect.
Initially, we should have a specific question, then start with basic visualization and be aware of your data, Identify the objective of the visualization and create an informative indicator, final step opt for the right visuals.
Any form of analytics data visualization skills is still in high demand. But business intelligence, data analytics, and other areas have started to adopt Business Intelligence visualization. In reality, more apps and processes are using visualization.
There are numerous scenarios when data could mislead in Data visualization such as Inappropriate methods of data collection, Inaccurate research parameters, unauthentic data sources etc.
SPEQTO assists many forms of data visualization such as:- Scatter plots, line graphs, pie charts, bar charts, heat maps, area charts, choropleth maps, and histograms are among the most popular types of graphs.
.webp "send-email")
